The analysis centers on interpreting recent signals from the bond market, particularly strong demand at a 30-year Treasury auction, as an early indicator of shifting investor sentiment. This demand suggests the bond market may be pricing in expectations of slowing economic growth, cooling inflation, and potentially restrictive monetary policy, contrasting with the popular "debasement trade" narrative that favors hard assets over bonds. The discussion explores whether this signals a broader transition to a "risk-off" market phase. Drawing parallels to the dot-com bubble, the report notes current similarities such as extreme stock concentration and diverging market breadth, but also key differences including the lack of a massive speculative peak and the stronger cash positions of leading tech companies. While a severe crash like 2000 is considered unlikely, the setup warns of potential increased volatility and a bear market for risk assets, possibly resembling 2022's downturn. The conclusion advises monitoring indicators like the two-year Treasury yield and market breadth for signs of a broader rotation toward defensive assets, even as the transformative potential of AI presents a counterbalancing bullish case for technology equities.
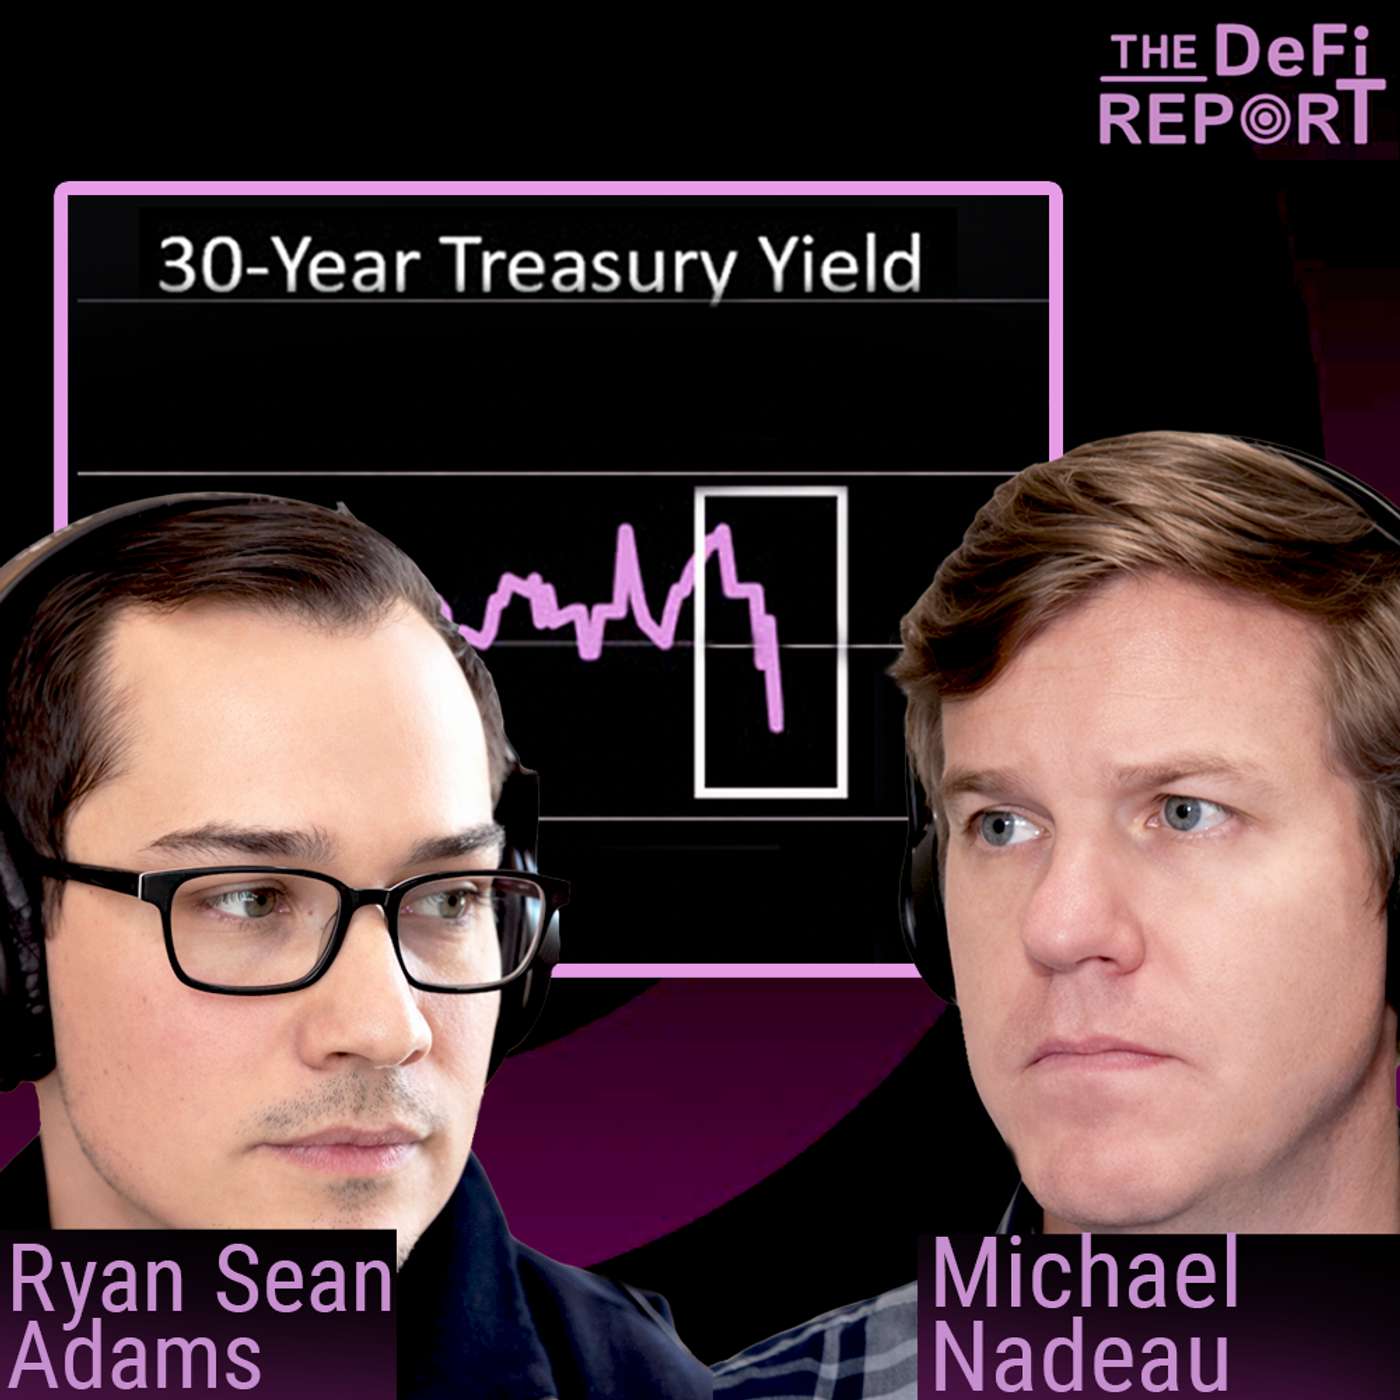
[MUSIC] Welcome to the D5 report. Today's report is going to be a macro update today. What's the bond market telling us as crypto stalls in this low range? The biggest question right now, a question that Mike has answered on today's report, where are risk on equities going? Where's the risk on market going? There are some clues in the bond market. They might be flashing a warning sign for US stocks. Is the AI bubble about to burst? I'm going to ask Mike that question. Also, question of whether Bitcoin is the canary in the coal mine for all of these risk on assets. We've got to figure out what's going to happen next as always. Stay tuned into the end. You'll get details on how this impacts Mike's portfolio. And honestly, some adjustments that I am making personally in my portfolio as a result of reading today's report. Also, we have our first friend and sponsor at the D5 report. This is Galaxy. It's ones for the institutions, whether you are looking at the future of finance or the backbone of the next industrial revolution. Galaxy is an aim you need to know. They've established themselves as a global leader, not just in digital assets, but also in critical data center infrastructure that's powering AI. This is kind of a dual thing, crypto plus AI. What's unique about Galaxy is the way they are bridging these two worlds. They are providing a full stack platform for digital finance. So you know this means institutional training, custody, tokenization. And they're also building a next gen industrial revolution through AI-ready data centers, including their heliosight with a staggering 1.6 gigawatts of approved power. This is a publicly traded company. You know, the ticker GL XY and the leadership is bringing a level of transparency and durability. It's pretty rare in the crypto and AI space. If you want to see how Galaxy helps institutions invest, build and transform relentlessly, go check them out. There's a link in the show notes, banklist.cc/galaxy. Okay. So let's get to that. This episode, the positioning right now is kind of risk on. We got one fat pitch. We're waiting for the next. Mike is positioned 66% cash. He's got a Bitcoin position. There's two other crypto assets in the portfolio. We'll give you details at the end. This report though is about the bond market and what it's telling us. Mike, why the bond market? The bond market feels so boring. Are there clues in here for investors? Not in Mac or land again. That's what we're going to do in this week's episode. Some interesting stuff happening in the bond market. This is very, very early stage, but we've got a chart up right now just looking at the long bond and the 30 year treasury yield. We had a pretty decent little move last week, which I would say is like nothing to write home about just with that little move. But there was a treasury auction last week for 30 year treasury and this is where the signal is. What we saw with this auction is that there were just a lot more buyers. There was a lot more demand for long bonds that we've seen more recently. The bid to cover ratio was 2.66, which is much higher than normal. The primary dealer take rate was much lower than what we would expect. I want to dig into what are some of the signals, what are some of the takeaways with this early warning signal that we're seeing coming from the bond market? I don't often look at bonds. I think many listeners are probably with me in that and we might need to level set. I do, however, enjoy bond macro takes because some of my favorite investment space, like people like Howard Marx. These guys are bond investors. There's something you can tell about the bond market that affects all other assets because everything at some level is downstream. Going into this episode, in general, my take has been long-term bonds are trash. Fiat, they're going to evaporate against other hard assets from a duration perspective and from a time perspective. I don't want to hold them in the portfolio. I think this report has maybe changed my mind slightly, but we'll get to that. What we're looking at here on screen is the 30-year treasury yield. These are long bonds and there's a chart here and that's showing us something. Then there was a February 12th auction, bond auction. Every once in a while at some interval, I'm treasury auctions, a set of bonds. These are 30-year long duration bonds. I think what you're saying is there was pretty high demand for these bonds in that investors wanted these long bonds. Previously, the demand had been lower. Is that what you're saying? Yeah. That's a signal. This is like very early stage. It's one auction, but what stood out here is the bid to cover ratio. You're right. I think the narrative or at least the appetite for bonds has been very low. The first people are looking at the fiscal setup. The bond market doesn't run on vibes and speculation. It's very math driven. It's looking at growth. It's looking at inflation. When we see a rush to buy bonds, the signal is potentially that the bond market thinks growth is potentially slowing. That inflation, I think there's kind of dueling views. There are some people think that growth is slowing. Some people think inflation is still a problem. To me, when you see this demand for treasuries, and we've got a chart here just looking at real interest rates and break even inflation, and they're both coming down. To me, these are pretty clear signals that inflation is not the issue right now. I think that is why you're seeing some of this demand for treasuries. What's interesting is when they do these auctions, there's the primary dealer banks and 25 to 30 banks, the big Wall Street banks, they have to support the treasury in these auctions. Basically, whatever the rest of the market doesn't stop up, the primary dealer banks take those treasuries. What we saw last week was that there was only 5.9% of the offered treasuries that went to the primary dealer banks. Historically, we typically see that's in the 10 to 20% range, sometimes 25 to 40%. To me, the takeaway was that there is a large fire in the market. Is it pension funds? The pension funds, they have to balance their liabilities. They're looking out and say, "We think rates are coming down. We're going to buy these bonds now so that we can pay out our liabilities at these higher rates." What is that signal? Like I said, one auction, but this was a little bit of a phase shift from what we've typically been seeing in the bond market. Early signs of a phase shift, and you wrote this, it appears that the bond market believes that growth, number one, growth is slowing. Number two, inflation is cooling. Number three, monetary policy may be restrictive. I got to say here, Mike, this feels like it's somewhat of a narrative violation. Let me tell you what the narrative is. The narrative is the debatement trade. Gold is going up. Long-term bonds are trashed. You don't want to hold them because they are going to debase against harder assets. If you want to play, maybe you do US equities because AI is massive, but you don't want long-term bonds. The idea that bonds, US bonds and particularly long duration, are a risk-off asset, well, that goes against the debatement trade because capital is fleeing the US because the dollar is debasing. You're saying the opposite. You are a counter the narrative of the debatement trade if I'm understanding you correctly here. That's right. Yeah. I think that's exactly right. I'm seeing here, and I think the bond market, I tend to think that the bond market is usually right because I'm saying it's very just math and debate driven. If people are looking out and going out to buy bonds, it's telling you that they think growth is slowing and flation is rolling over. The Fed is potentially restrictive. That's not an environment where a debatement trade is typically on. I think that the basic contract could potentially come back if you saw the monetary policy or critical policy shift in response to this, but we're not right there just yet. You think that this is basically following Michael Howell's asset allocation cycle, and we are currently in the late cycle. Commodities have outperformed, and commodities are generally the last asset class to go. And what happens is investors turn to bonds, treasuries, of course, but even mid-duration and long-duration bonds. You're starting to see it in the macro setup, some of that playing out, which means we are phasing into the risk off mode of the cycle. What gets punished in risk off mode and what gets rewarded? It sounds like bonds would be, they'd hold up well. are essentially the flight to safety.
But what gets punished in the scenario if the setup is correct? Yeah, what gets punished is probably risk assets, commodities, and what's where I think people are starting to potentially rotate to and keep an eye on the dollar here as well. We see the dollar getting bid that's sort of a signal that people are selling assets going back to dollars, but I think potentially the dollar getting bid and then longer duration bonds getting bid. I think this will be somewhat temporary because here we're looking at a chart of the two year treasury yet. So we're talking about long bonds. Now we're going to the short end of the curve and the two year tends to kind of lead the Fed funds rate. There's a lot of history on this. The Fed looks mostly the time like it's actually responding to what the two year treasury yield is doing. And so this is interesting to keep an eye on. It looks like monetary policy is restricted because the two year is dropping below the target Fed funds rate. It's dropping right into that 3.4% range where it's been really kind of shopping around for five months or so. And so this is Fed funds is 3.5 to 3.75% so it's kind of below that right now. It's below that and that's telling you that it looks like the Fed is restrictive relative to whatever whatever the neutral policy is. We don't really know what that is, but we think it's kind of what the two years trying to tell you. And it looks like it's restricted relative to the two year. And so that looks like it's bouncing around right on a pretty significant trend line at that 3.4% there. So if we break that trend line, where does that is that going to be a cascade or are we just going to kind of come down just a little bit, that's what I'm watching now is that two year to see is it just going to come into the 3.2% range? That would to me would signal that the Fed is increasingly restrictive. And I would expect more volatility to come into the markets until the markets got some sort of all clear about how monetary policy was going to respond to that. And if that two year drops faster, that would be potentially a scenario where the market would probably start to price in like wrap it in Fed cuts. Like this is probably not something that I haven't seen too many people talking about this because I think most of the narrative is that we're in a, you know, a reflation trade and a debatement trade. But the setup does not say that right now to me. So interesting. So the setup is you're seeing early signs of Fed cuts, both deterioration. This could bring financial stress to a risk on asset, which mean equities, which we're about to talk about again, but you're keeping an eye on the two year yield. Let's talk about then the stock market right now. And where we are right now is basically where you know, a tech landscape. I won't call this a bubble yet, but you tell me if you think that applies, but equities have been on an absolute tear over the past two or three year, particularly US equities, particularly centered around the NAS and AI stocks and the mag seven. You put it into here. This is somebody Michael batnik saying, this is a wild market. We haven't seen any like this since the dot com bubble burst over the last eight sessions. 115 stocks in S&P 500 have declined 7% or more in a single day. The average drawdown when that happens is 34% right now. We're at 1.5% below the all time high. He posted that last week on February 12th. Is this just a tweet about throwing volatility in the stock market? It's just like a wild market out there and it's sort of heat. He brought into play the dot com bubble burst. Are you seeing signs of something like that? It's interesting to see again. This is like kind of early stage. You've seen this. It's picking up what's happening is breath is diverging. Earlier in the cycle, as NASDAQ rises or as the mag seven rise, the market has been mostly rising together. SOS was performing Fintech. Now what you're seeing is just like all these different rotations between sectors and assets out there. I think the thing to pay attention to is just like, okay, something kind of has clearly shifted here. People are going more towards defensive stock, ox towards energy. That's kind of interesting to note. What we did in this report this week is we try to understand, when bubbles break down, if we go back to 99, 2000 and observe what was happening at that time, do we see similarities? I think there are some similarities in terms of the setup. I don't think we're in as extreme of like a potential bubble right now. We haven't had this just extreme blow off top. We had back in 99. However, there's a lot of similarities. Maybe I'll just read through a few of them here. Yeah, let's see. This is very interesting. This is, I think, the key question of where is risk ongoing, where US equity is going. Are we in something like 1999 or 2000? Give us the sequence of events from that bubble time and let's compare. Yeah. This is the history. Back in 99, this kind of started like mid-99. Where the bubble kind of peaked out, it was like mid-99 to the end of 99. Then, Q1 of 2000 is when it burst. Over that period, you had breath diverging. Similar to what we're seeing now, the indices were still rising, but you had fewer stocks that were actually participating in that. That's what you mean by breath diverging. Exactly. It's like fewer stocks are getting the upside and leaving everything else behind. Yeah. There's just kind of rotation happening, new positioning, and just not just a rising tide lifting all the boats. We did have this in the middle of 99. We saw the same extreme levels of concentration. It's actually more concentrated in the Mag 7 today that even it was with the top five to seven stocks back then. You did have concentration and returns were really consolidating. We also started to see dispersion amongst the winners. This is also happening. The Mag 7 there, we're starting to see some Mag 7 players like Microsoft not do so well and others do better like Google. Actually, there's some similarities there. The other thing is the Fed was restrictive back then that the Fed was actually hiking rates. It wasn't neutral or cutting like we were seeing today, but they were actually hiking rates and they were restrictive relative to neutral. But there was no signal of it in the economy like in 1999 or mid to late '99. Some similarities here. When we get to stage step five here, growth started to slow. The hiring started to slow. There were some leading indicators. These are the things that we're trying to keep an eye on. Things like quits in the labor market. The labor market is mostly holding up, but we're trying to see if there's signals in terms of confidence and things like that. We're starting to see that. I think there is evidence that growth is slowing and some of these leading indicators are rolling over. Then what is the next thing that you typically see is the bond market. It's usually the first ones to kind of sniff that out out. That's the big question. Is that what we're seeing now is a similar setup where you had this Russian to tech, basically this new industrial revolution that we have going on, all the investment that's going on with that and how everyone has got a little overstretched. The narrative is that you don't want to hold cash. You don't want to hold bonds. There's nobody in these assets. That is the setup for the rotation. We'll see. I think this is early, but I think it's important to observe what's happening out there and be prepared for what can come. Then what happened? That was step six. Then what happened is of course the catalyst hit. That happened in March, April 2000. There was all sorts of news of recession in Japan. It was a Microsoft antitrust ruling at that point in time. I barely remember that. Then the narrative completely shifted and it shifted in a hurry. Then of course, we saw a tech sell off. That was the dot-com bubble bursting. Nasdaq dropped 78%. Oh my God. It's trading like an all-coin. From March 2000 to October 2002, bonds of course rallied as the defensive asset, the safe harbor asset, defense sectors also performed. I guess that would be September 11th on the back of that. If you compare that setup in those eight steps to what we're seeing today, we're seeing some of these things. The breadth diverging, the stream concentration, that's clearly, we've already seen that. Let's play it out of the past 18 months, two years. The dispersion, you mentioned that's playing out. Step four, which is a restrictive fed. We might be actually seeing early signs of that. The growth, slowing, step four.
I'm not sure that we're seeing it. At least it's not clear right now. Maybe inflation is cooling as you say. Housing markets seems like it could be weakening. Retail sales being flat, so consumer confidence. Maybe we're seeing that as hard to tell. That's somewhat murky. And then number six, the bonds rallying. Well, this is what your entire report today is about. It's seeing early signs of bonds rallying. Now of course, we haven't seen step seven and step eight when the market term goes terminal. And we actually get kind of a big sell-off and a crash. But if you squint, I suppose you can see something similar that played out in the end of 1999 and early 2000. Now the end of 1999, if I recall, and into 2000, there was like the mother of all candles up, right? It was like, there was a massive end surge of the bull rally before all of this chaos happened. And we haven't seen that yet. So maybe there's one more candle ahead if this plays out exactly the way it did previously. But again, we're not guaranteeing that it'll play out previously. So it's not quite a one-to-one match, but I guess if you squint, you can see it? Yeah, I think that's kind of like how I'm thinking about this. The differences here are that, like you said, we didn't have the big blow-off top. And also, we're dealing with like Max said, having companies that are very profitable, mature companies. So these are not just names or just software companies. It's not like debt funded yet. Is it? It's mostly cash funded. Mostly, mostly, most of the build out has been funded with free cash flow. That's shifting a little bit this year. So the market's starting to process that a little bit. But yeah, definitely some differences. And so that's one of the reasons why I think if this starts to kind of play out the way it's trending, in my opinion, I think maybe we get a bear market, but I'm not expecting it to be like a 78% NAS that I draw down or something like that. I think it'd probably be more of like a 2022 type of bear market for NAS. Like maybe even more mild. But importantly, we have a number of indicators here that we're just going to keep an eye on and update people in some of this research. Let's steal man the other side of this, because so you've given kind of the bear case for risk on assets and why equities and NASDAQ could sell off. And but now let's go to the other side because everywhere I look, I still see bullcase type signs from AI, like something new with AI wows me on almost like a daily basis. Like the tech is real. And so what I think is the case for why AI stocks will continue to outperform here, and we won't go in full risk off mode. Yeah, and I think you can make a compelling case here. So I always want to entertain kind of the other side here. But I think one thing you would point to is the amount of capital that I'm going to keep on going. So I think that's the case for the case. So I think that's the case. And the case for the case, I think that's the case. And so I think that's the case. And it can, I think, give you a little bit more of like a real time view of what's happening out there. And that's down at 0.96%. So when you see the bond market telling you that maybe growth is cooling, break even, inflation is coming down, trueflation, like there's enough kind of indicators here that maybe, you know, this is this is legit. And then when you look at the two year telling you that, you know, if the bond market thought inflation was an issue, that the two year, you know, wouldn't be below the Fed funds rate right now. So, so, so that's another important point.
and then liquidity is tightening out there. We have real rates, well, they've come down a little bit. They are still elevated at 1.77%. We think the Fed funds rate is restrictive, relative to neutral. And then something that I haven't seen a ton of people talking about is just like the refinancing that are starting to play out, particularly in the commercial to real estate sector. We talk about real estate in this episode, but there's a lot of maturing debt that has already been sort of rolled forward. Extended pretend is kind of what they call that when you extend your debt and just hope that, you know, rates come down and you have a chance to refile better rates. So a lot of that has already been extended. There is, we think roughly 1.8 trillion of loans that need to get refinanced potentially this year. And that's going to happen at much higher rates. So that's definitely sort of like a tightening on liquidity. And then another wildcard is just tariffs. We know tariffs are taking money out of the economy. We do think that like the tax refunds are going to offset that on the fiscal side in the near term. And the final thing is the consumer. You know, it's early stage on this, but we see some signs of weakening and what we're looking at there is the savings rate has dropped to 3.5%. The pre pandemic normal was around 7.5%. So that is telling you that consumers are spending into their savings. We've seen that retail sales have been coming in flat for December. And then when you see savings rate declining while credit card debt starts to grow, that's a pretty clear indicator that the consumers are starting to come under a little bit of pressure. So we're starting to see some early signs of this. And then when you look at the confidence stuff, obviously we had never seen consumer confidence at lower levels than we're seeing right now. A lot of that's related to the K-shaped economy out there. So that's kind of like the big picture setup for us and what we're anchoring to in the data. And then one of these things that I just keep wondering is like Bitcoin started to correct about four months ago, a little over four months ago. And is that sort of the liquidity index potentially for the triad-five markets? And is that a leading indicator? We've been looking at just doing some backtesting and looking at correlation. We have found that the correlation is stronger during bear markets. And that Bitcoin does lead. So the correlation was 3.3 times stronger in bear markets. So something to keep an eye on. So when you add it all up, we're shifting towards our risk on position here. But this setup to me feels like sort of a let's be patient. This is a wait and see sort of market for right now for me. So if you're right and Bitcoin is the canary in the coal mine and it's leading the NASDAQ again and Bitcoin is down, that's just a prophecy as far as what's about to happen with US equities and stocks. And it may not be a dot com level bust, but you would forecast based on all of this that the evidence is pointing towards risk off a K.A. You don't want to be over allocated to stocks at this point. And I would imagine crypto assets if the NASDAQ falls off, if S&P falls off crypto assets, they're still kind of positioned as risk off type of assets. They're going to get hit a second time. Possibly possibly. I think we've already come off quite a bit. I mean, I know people don't want to hear that. I mean, a lot of all coins are down 80, 80, 90 percent. Bitcoin's down almost almost 50 percent. But it's hard to match the world where they wouldn't be hidden. And I probably wouldn't be as bad as what we've seen in some of these other draw downs. But we'll see this is going to be interesting to see how this starts to play out here. And I don't think anything is imminent. I think it's kind of like a wait and see market where we're roughly four months into this latest Bitcoin bear market at these 10 to go like 12 months or so. So trying to stay patient, I think patience is kind of the name of the game right now. And so that means you are waiting for your next fat pitch, I suppose, for a Bitcoin price. Right now, position at 27 percent of the portfolio in Bitcoin, the other assets you hold in crypto are ether and coin. You just kept the coin stock. You're still kind of bullish relative of the coin. Yeah. Yeah. We've sold a decent amount of it, but still held on to a little bit of a coin and potentially looking to add to it. We actually were going to be covering coin on Friday in the watch list. So we're going to have some interesting data and yeah, a good report on coin based that people can, if people want to subscribe to our research, we actually give you the price targets and access to our portfolios. If people want to sign up for TD or Pro, otherwise the watch list is free and the data that goes with that. The watch list reports are free and those come out on Friday. Otherwise, almost a 70 percent cash position. So still kind of waiting. I got to say after I read this report and wait it with some of the other things I'm seeing in the market is the way I have adjusted my own personal portfolio is selling some stocks. So you'll like US equities that it's hard to kind of sell. It's very painful to sell right now when you're looking at everything that's going on in AI. But this has caused me to reallocate a little bit warm up to long term bonds a bit more. My previous philosophy was like they're trash, they're going to zero. And while that might be true in the long run, right? If you're doing a cycle type play, they're not bad assets to hold. I choose to generally express my view on your cash assets just through money markets and short duration treasuries. I don't play that game, but long term bonds mid term bonds, not too bad right now in this market. So this report, now there's like it have actually caused me to adjust my own portfolio. So thank you for that. And we'll see if this happens. Guys, of course, you can catch these episodes on a weekly basis. Mike and I drop them every week. You can subscribe on YouTube, Spotify, RSS. I want to thank everyone who gave this podcast a five star review last week on Spotify we've seen a whole bunch of those put in if you haven't and you're enjoying this. If this is part of your 2026 crypto journey, go ahead, give us a five star review on Spotify, a comment on YouTube. Otherwise, just engage with the content. That's how we propagate this to more people. Gotta let you know of course, none of this has been financial advice from Mike or myself. We're just investors on the journey alongside you. Until next time, stay curious. (gentle music)
Podcast Summary
Key Points:
The bond market shows early signs of a shift, with increased demand for long-duration U.S. Treasuries, suggesting investors may anticipate slowing growth and cooling inflation.
This bond market signal potentially contradicts the prevailing "debasement trade" narrative, indicating a possible move toward a "risk-off" environment where bonds could outperform risk assets.
Comparisons are drawn to the dot-com bubble era, noting current similarities like diverging market breadth and high concentration in tech stocks, but also key differences such as the absence of a major speculative blow-off top and stronger corporate fundamentals today.
The discussion highlights a cautious outlook for risk-on assets like equities, especially AI-focused tech stocks, while suggesting a potential rotation toward defensive assets, including bonds and the U.S. dollar.
Summary:
The analysis centers on interpreting recent signals from the bond market, particularly strong demand at a 30-year Treasury auction, as an early indicator of shifting investor sentiment. This demand suggests the bond market may be pricing in expectations of slowing economic growth, cooling inflation, and potentially restrictive monetary policy, contrasting with the popular "debasement trade" narrative that favors hard assets over bonds. The discussion explores whether this signals a broader transition to a "risk-off" market phase.
Drawing parallels to the dot-com bubble, the report notes current similarities such as extreme stock concentration and diverging market breadth, but also key differences including the lack of a massive speculative peak and the stronger cash positions of leading tech companies. While a severe crash like 2000 is considered unlikely, the setup warns of potential increased volatility and a bear market for risk assets, possibly resembling 2022's downturn. The conclusion advises monitoring indicators like the two-year Treasury yield and market breadth for signs of a broader rotation toward defensive assets, even as the transformative potential of AI presents a counterbalancing bullish case for technology equities.
FAQs
The bond market is showing early signs of a phase shift, suggesting that growth may be slowing, inflation is cooling, and monetary policy could be restrictive. This is indicated by increased demand for long-term bonds, such as the 30-year Treasury, in recent auctions.
A rally in bonds often signals a shift toward risk-off sentiment, which can negatively impact risk-on assets like equities and cryptocurrencies. If bonds are seen as a safe haven, capital may flow out of riskier investments.
Yes, there are some similarities, including diverging market breadth, high concentration in top stocks (like the Magnificent 7), and early signs of a restrictive Fed. However, key differences exist, such as the absence of a major blow-off top and more profitable companies today.
In a risk-off scenario, bonds and defensive sectors typically perform well as safe havens, while risk assets like equities, commodities, and cryptocurrencies may face selling pressure. The U.S. dollar might also strengthen as investors seek safety.
The 2-year Treasury yield often leads the Federal Reserve's policy moves. If it drops below the Fed funds rate, it can signal that monetary policy is restrictive, potentially leading to market volatility and expectations of future rate cuts.
The debasement trade suggests capital is fleeing the U.S. dollar and traditional assets like bonds due to currency devaluation, favoring hard assets and equities. Current bond market signals contradict this by indicating demand for Treasuries, implying concerns about slowing growth and cooling inflation.
Chat with AI
Loading...
Pro features
Go deeper with this episode
Unlock creator-grade tools that turn any transcript into show notes and subtitle files.
 PodcastTranscript AI